Air pollution falling across UK cities, latest data shows
Air pollution has started to improve in many UK cities, following the same pattern set by other countries where travel and outdoor activity have been restricted.
New analysis shows that levels of nitrogen dioxide and small particle pollution are significantly lower than the levels normally seen at this time of year in most of the UK’s largest cities.
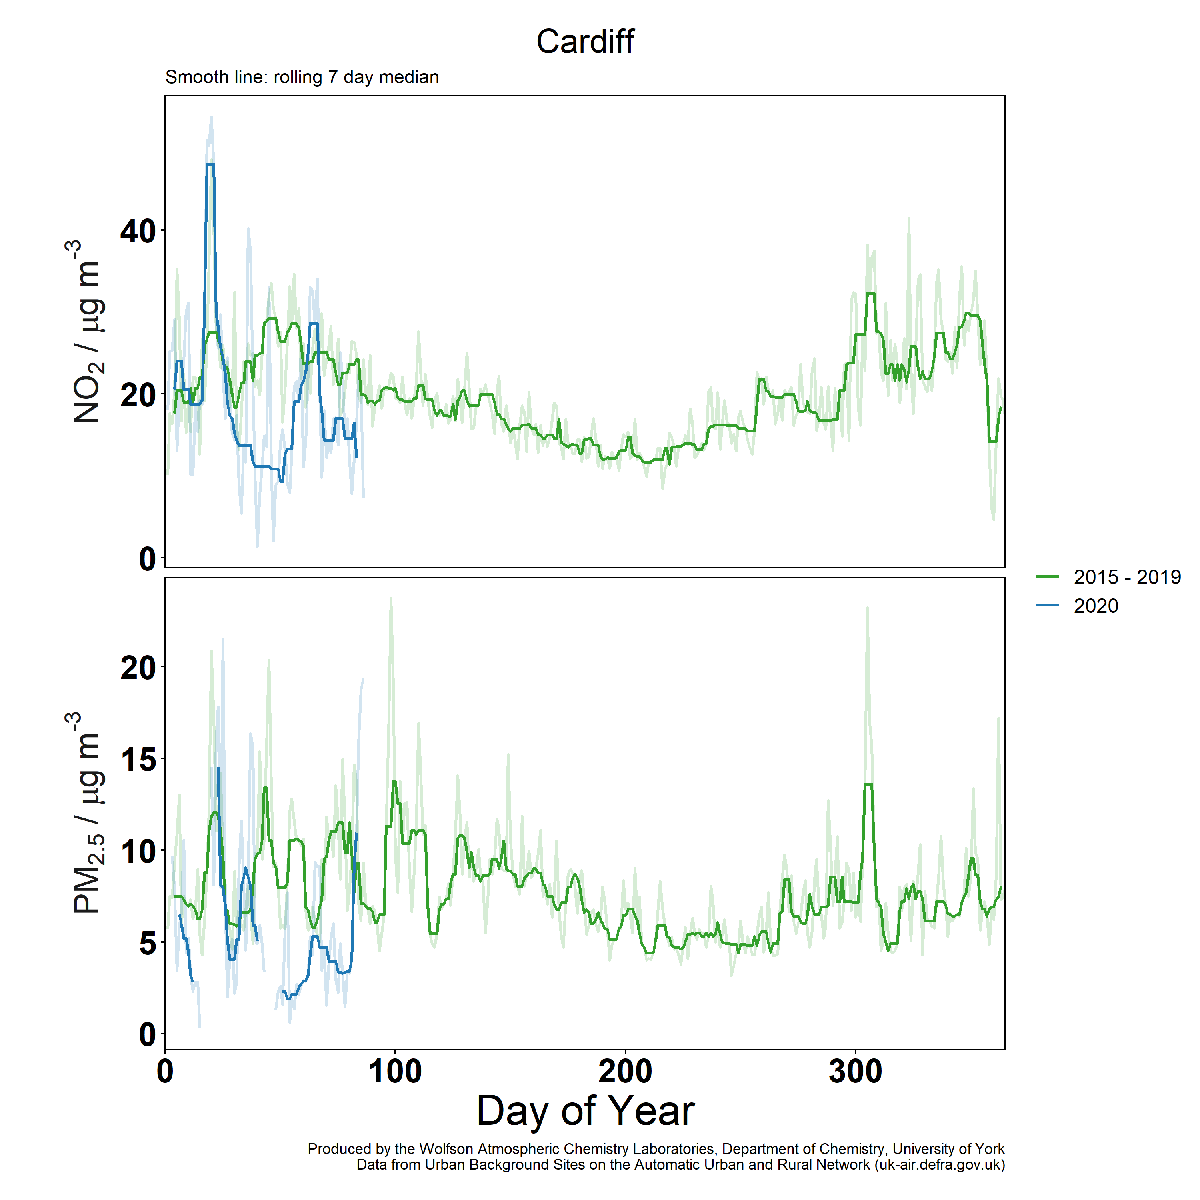
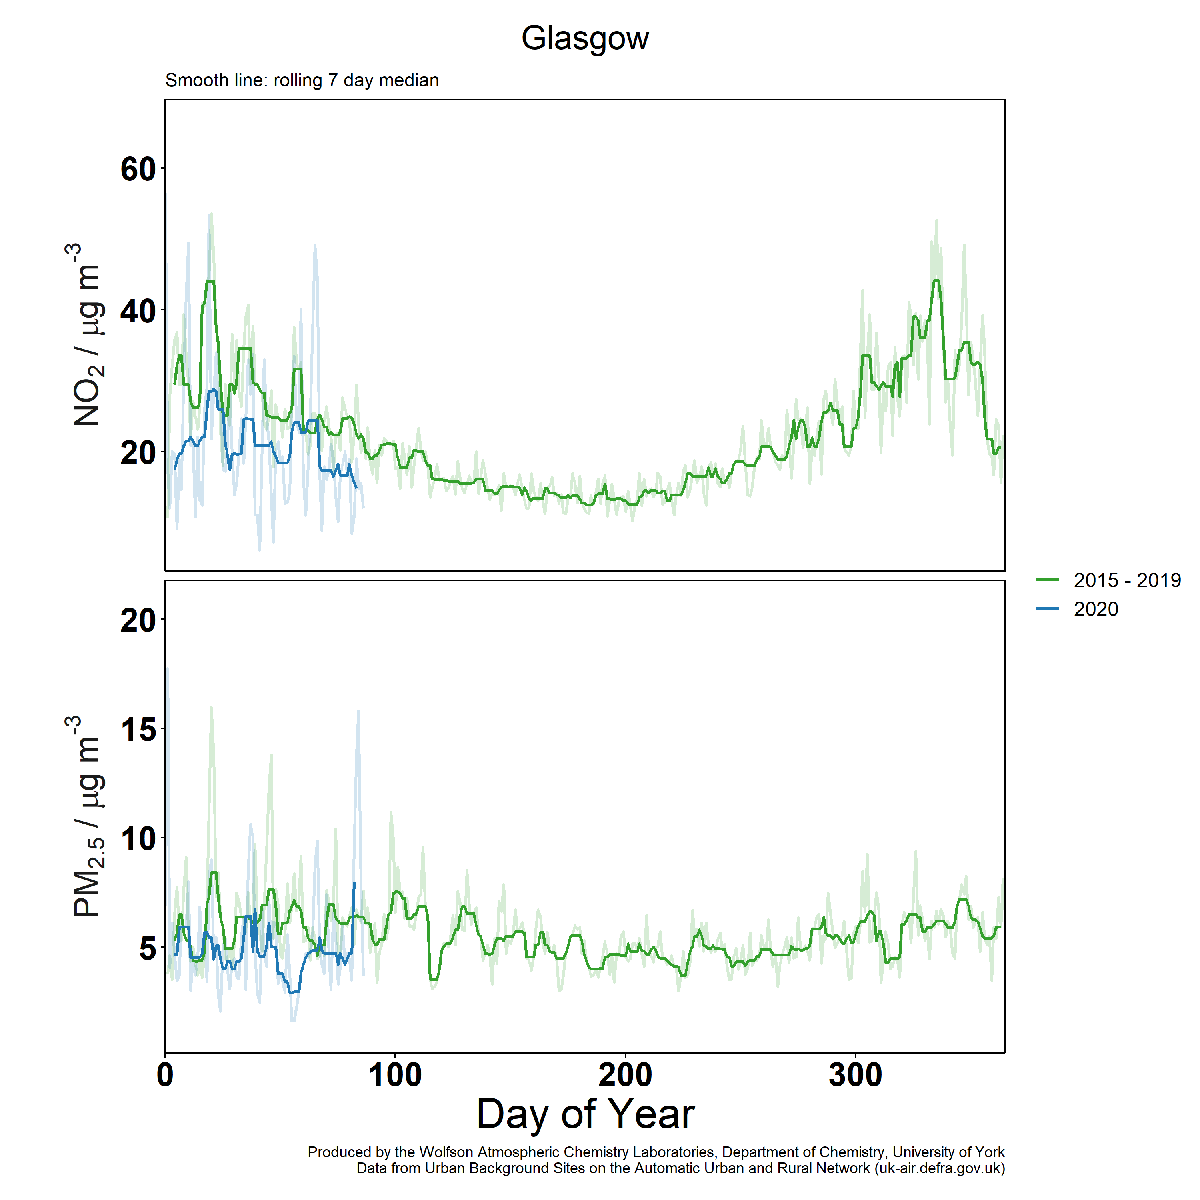
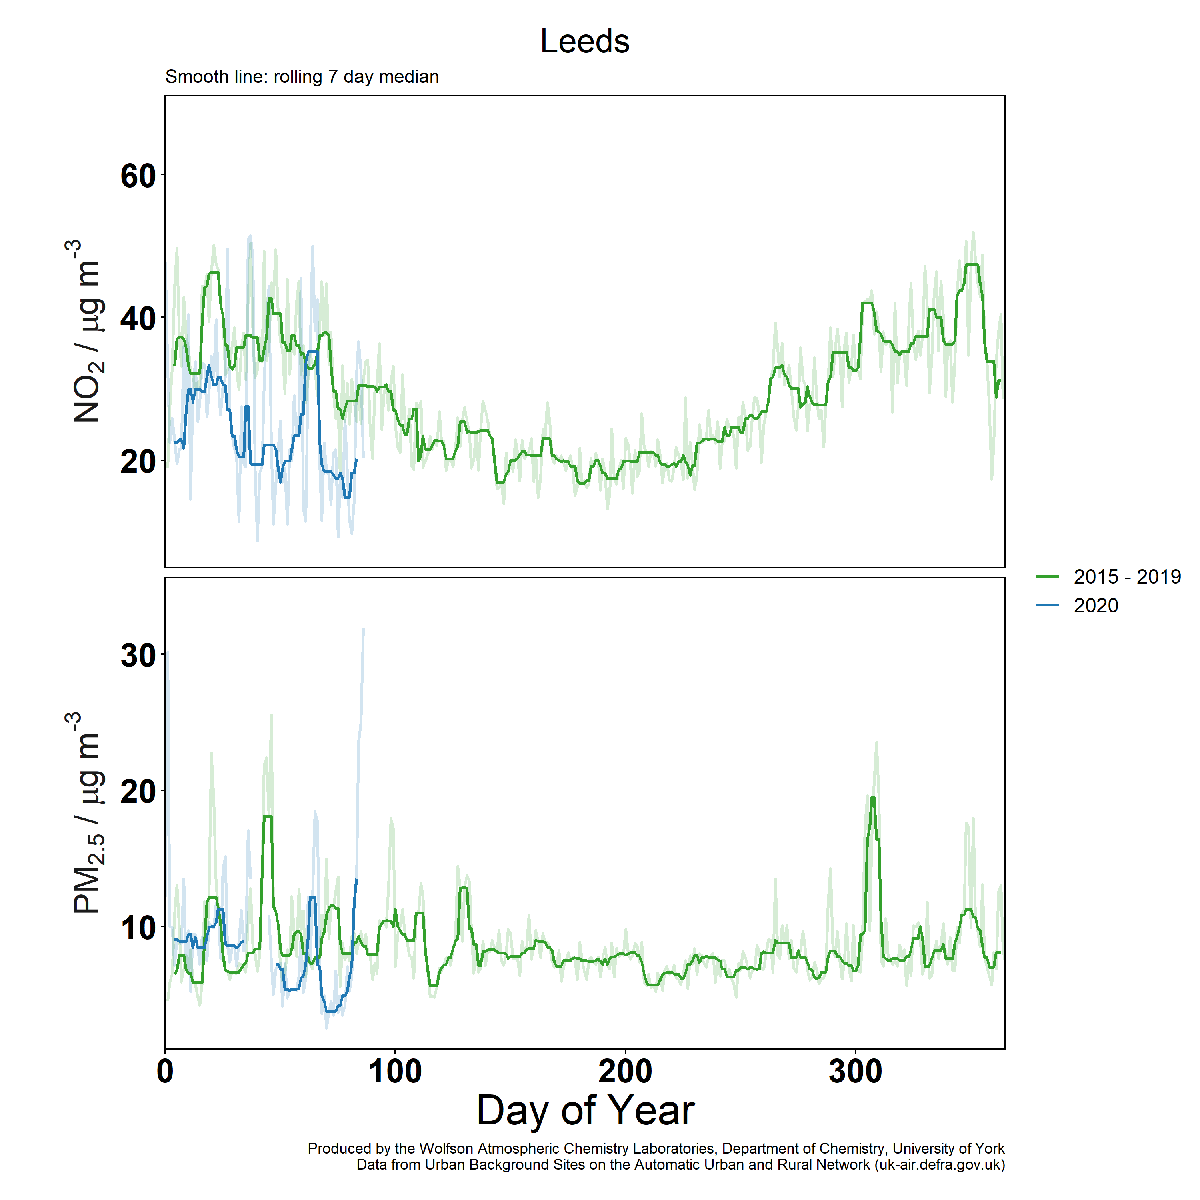
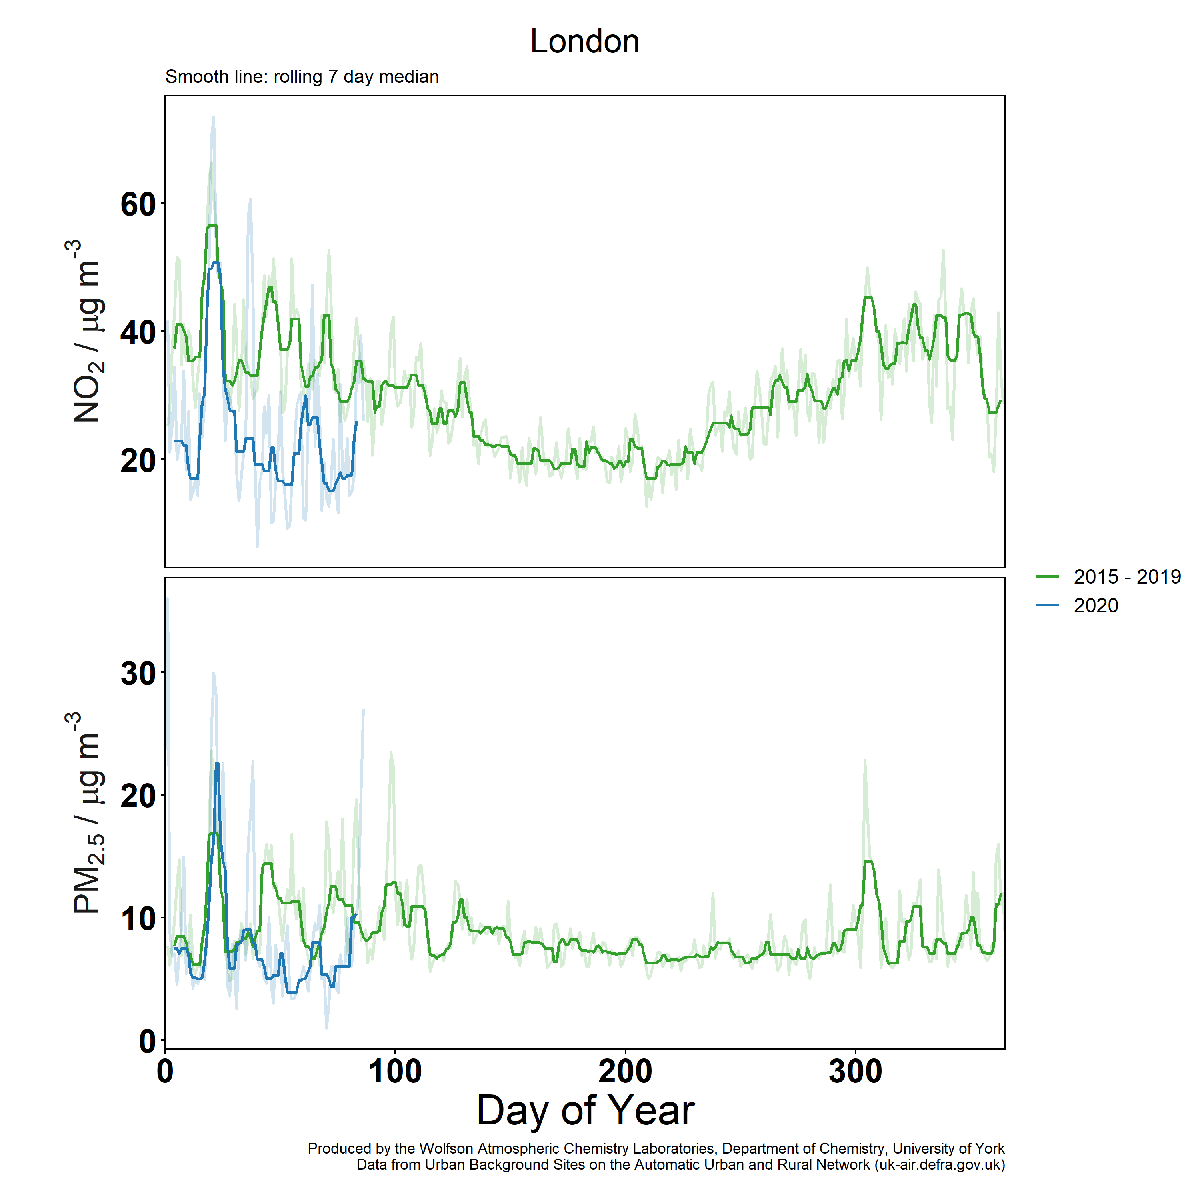
Scientists from the National Centre for Atmospheric Science based at the Wolfson Atmospheric Chemistry Laboratory have produced a set of graphics that compare this year’s air pollution levels to the average level of air pollution over the last five years.
They have plotted the pollution data from ten UK cities.
Download our air pollution data for Birmingham, Belfast, Bristol, Cardiff, Glasgow, Leeds, London, Manchester, Newcastle, York.
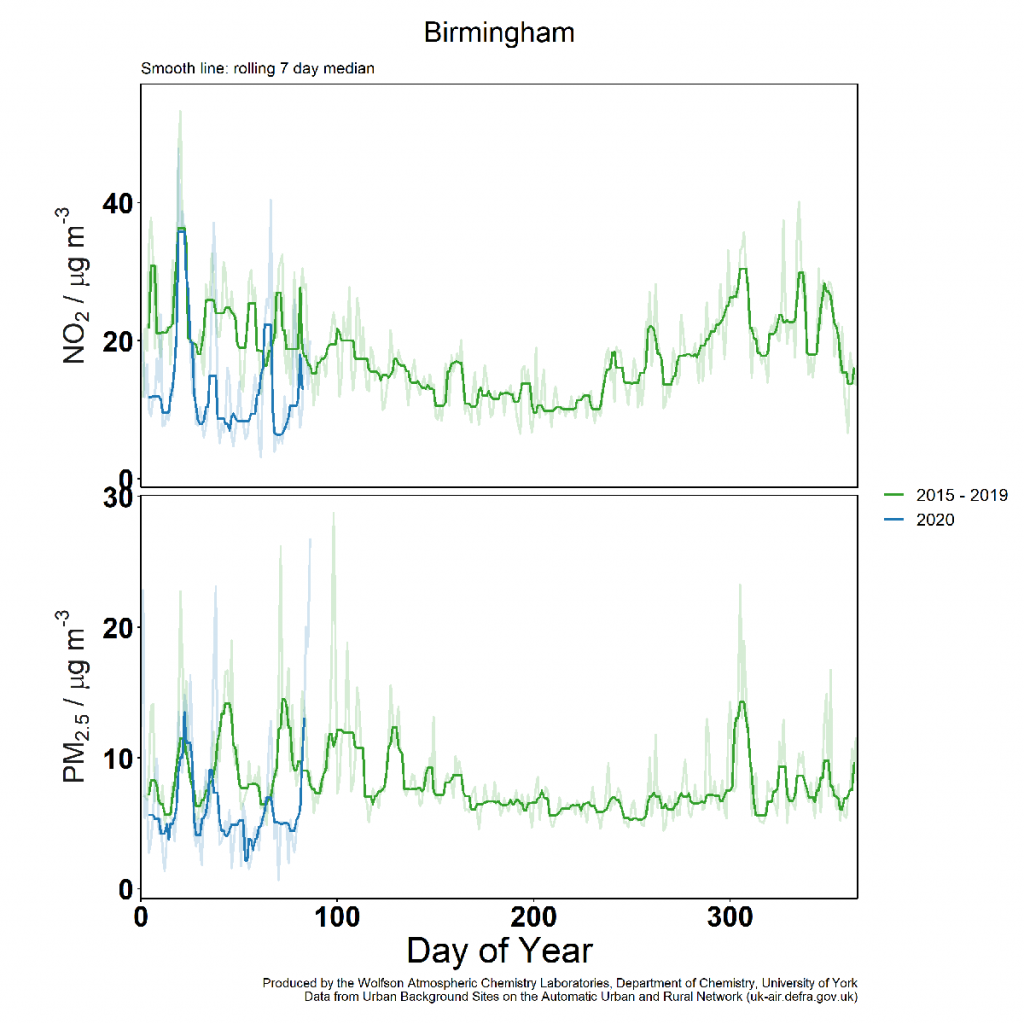
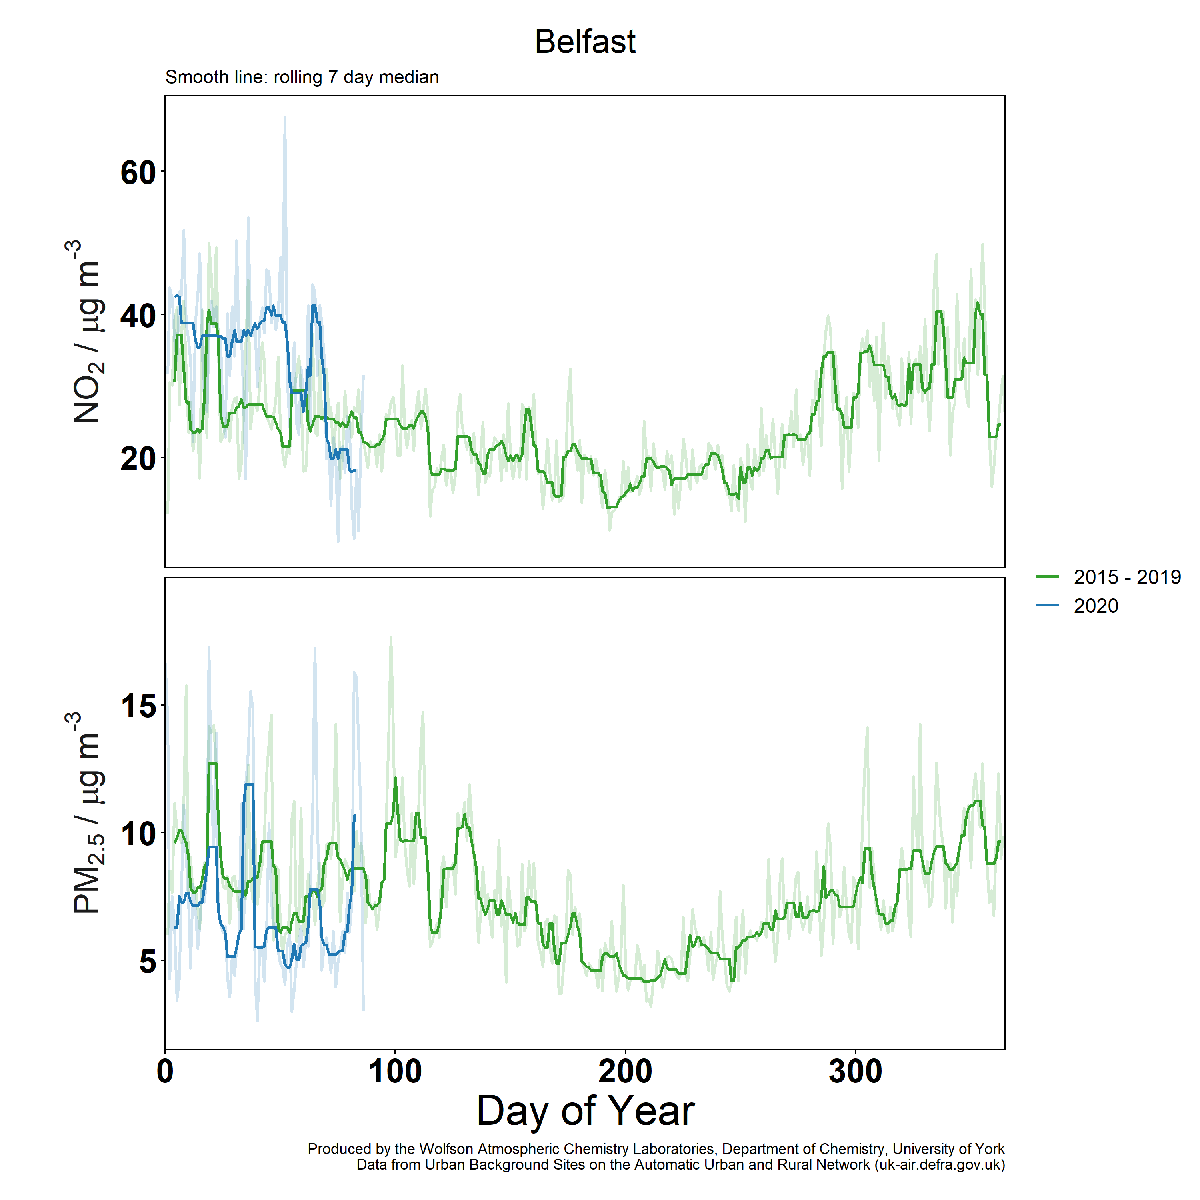
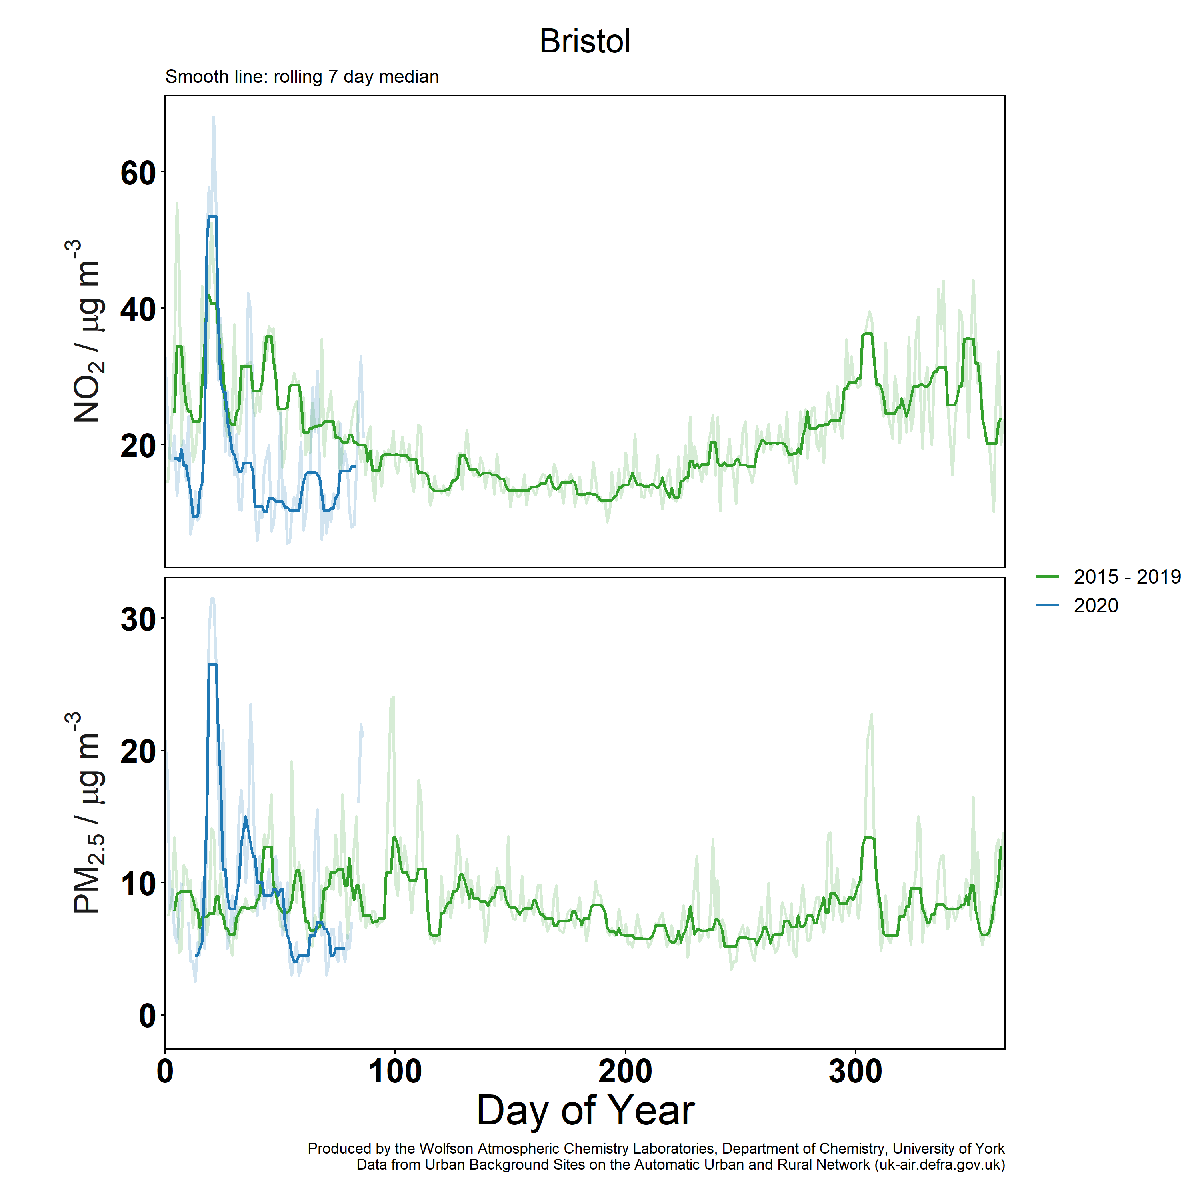
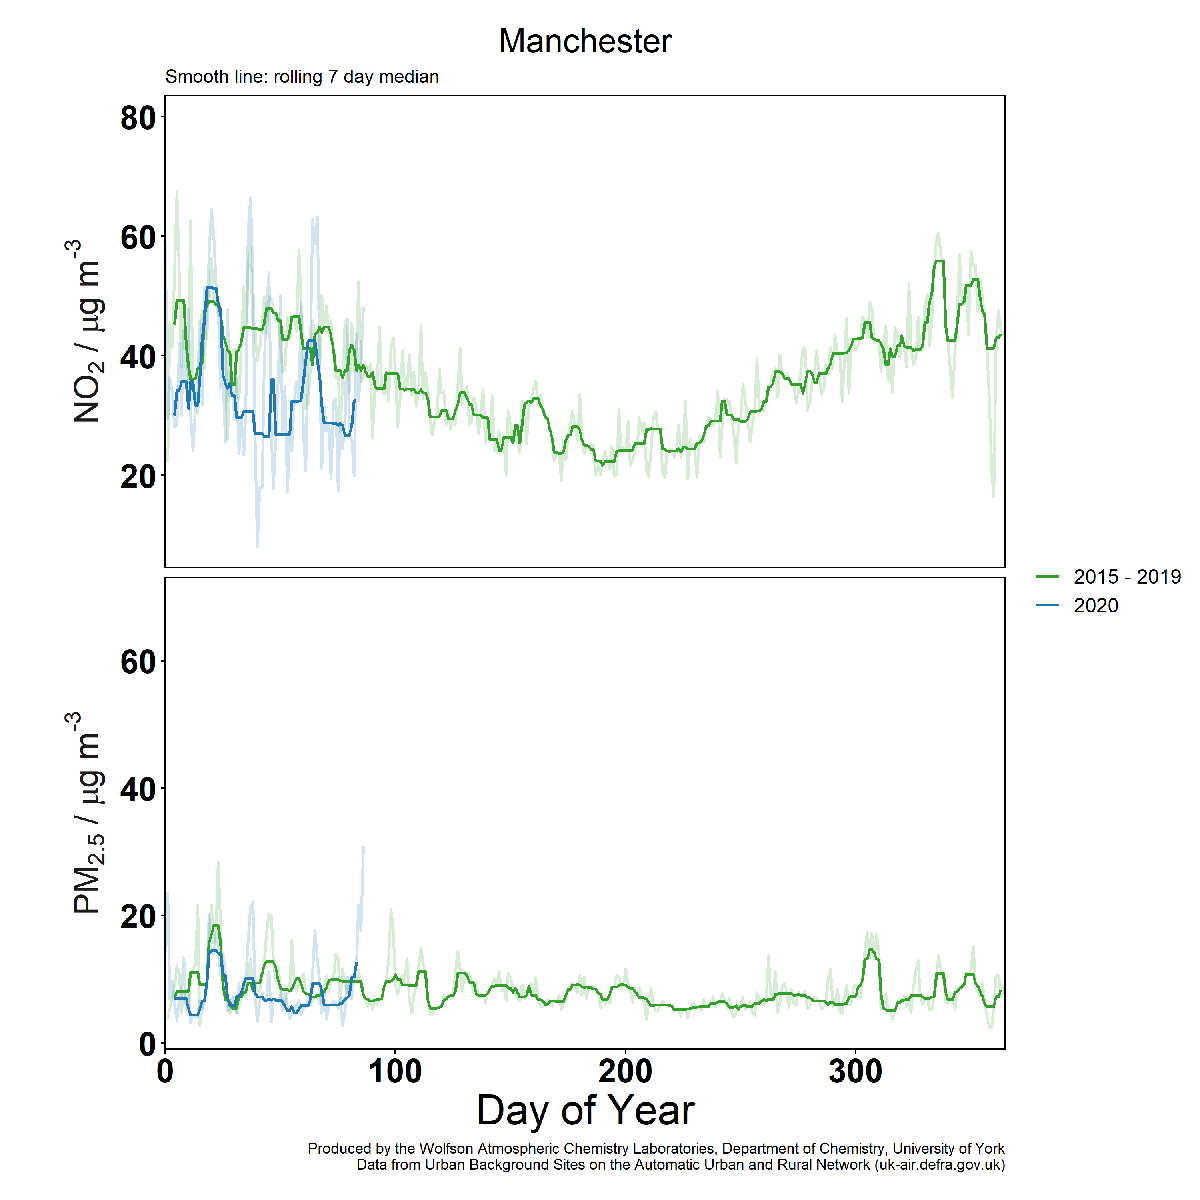
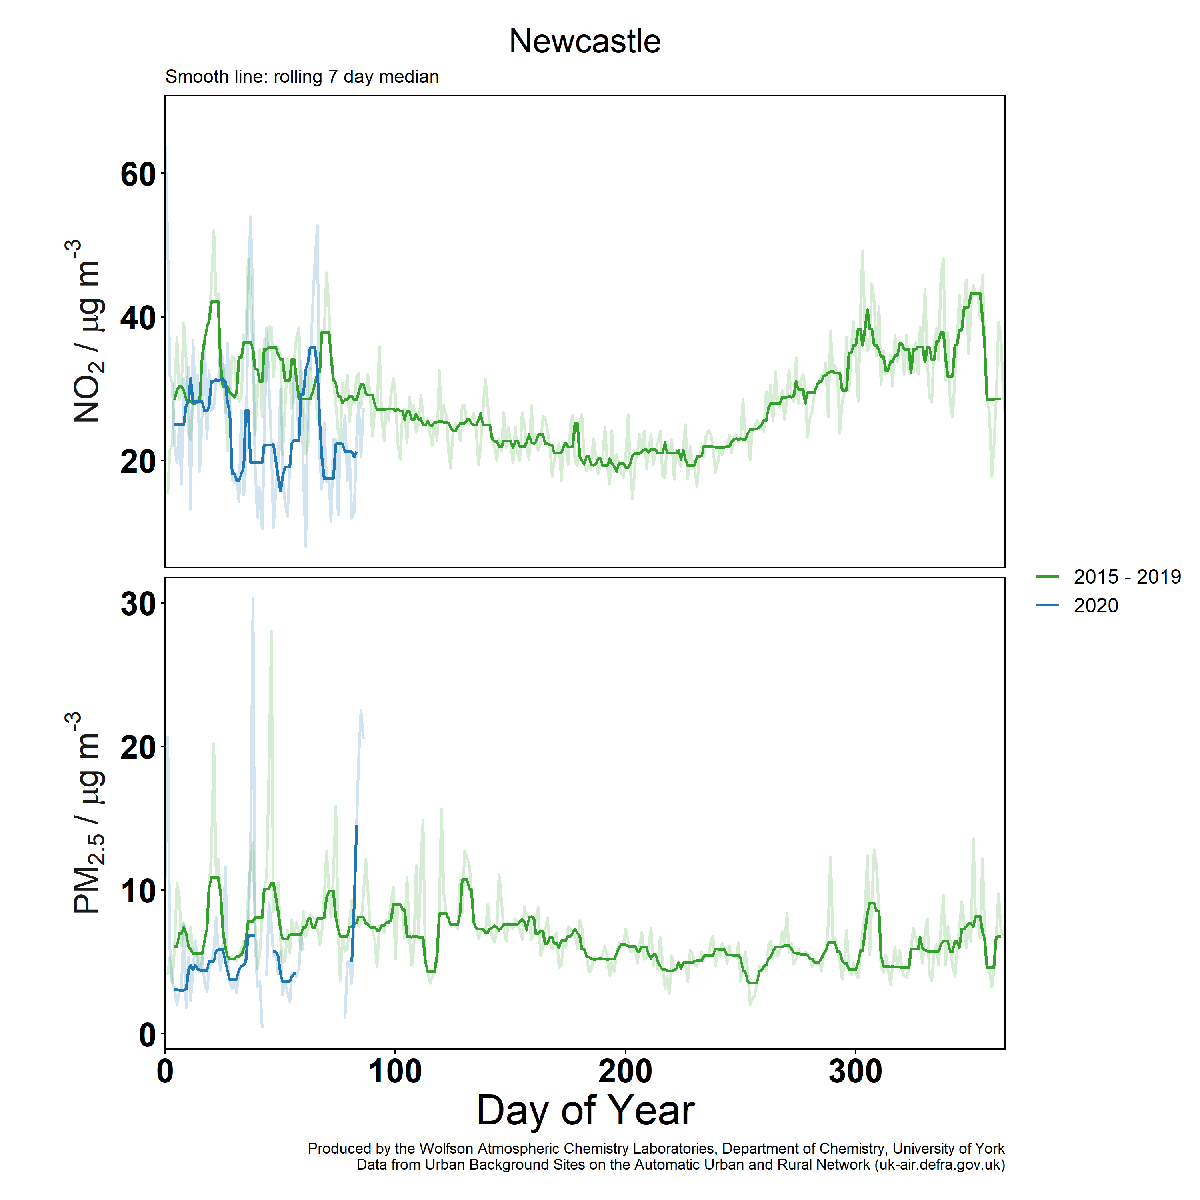
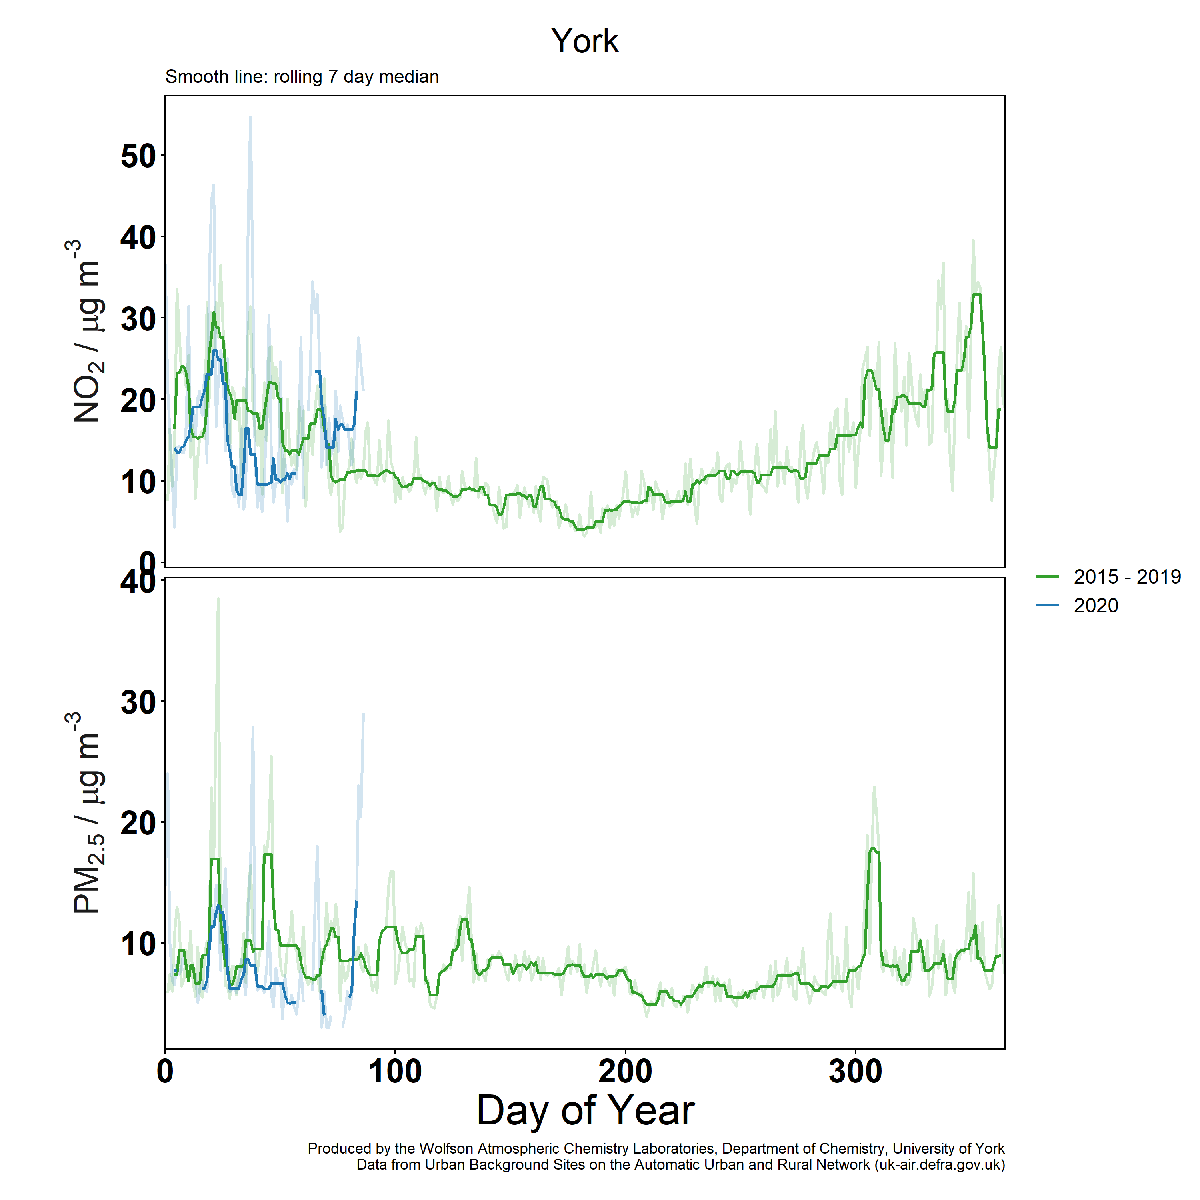
For each location, the top graph plots the levels of nitrogen dioxide. The bottom graph plots the levels of small pollution particles, known as particulate matter.
Both nitrogen dioxide and particulate matter can cause severe respiratory problems and worsen existing conditions such as asthma, so any reduction in pollution levels will benefit public health.
The current level of air pollutants is marked by a blue line. The green line shows the average level of pollutants over the last five years.
Making sense of the pollution levels
Scientists stated that the best way to assess whether air pollution levels are higher or lower than usual is to compare the current levels with the same dates in recent years. This is because pollution can vary throughout the year based on different weather patterns.
“The air is definitely much healthier. These are big changes – pollution levels at the moment are the equivalent of a holiday, say an Easter Sunday”
Professor James Lee, National Centre for Atmospheric Science and University of York.
The data comes from background air monitoring stations in cities, sited away from main roads. “We chose these because that is where people live,” said Professor James Lee, who plotted the latest data.
In most cities, the level of nitrogen dioxide and particulate matter is below the typical level for this time of year.
In the graphs below, the blue bars show the average level of pollution from late February through to late March, taken from 2015 and 2019. The red bars show the average level of pollution between the same dates this year.
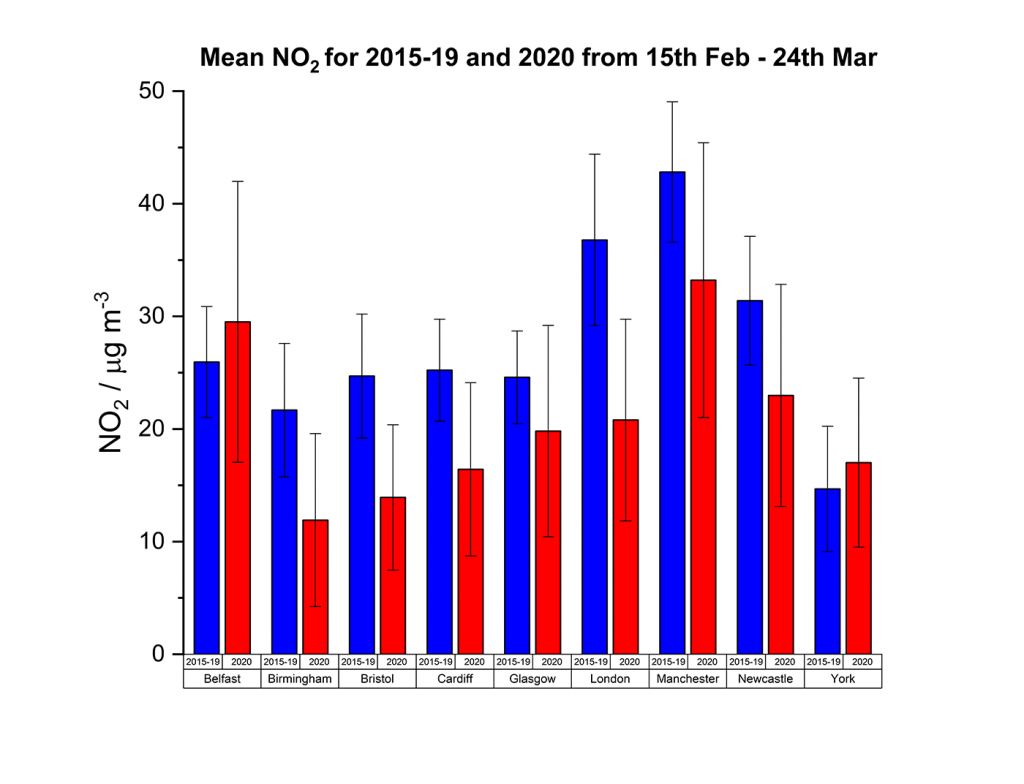
There are only a few exceptions to the pattern. These are in Belfast and York, where the level of nitrogen dioxide is slightly higher than usual.
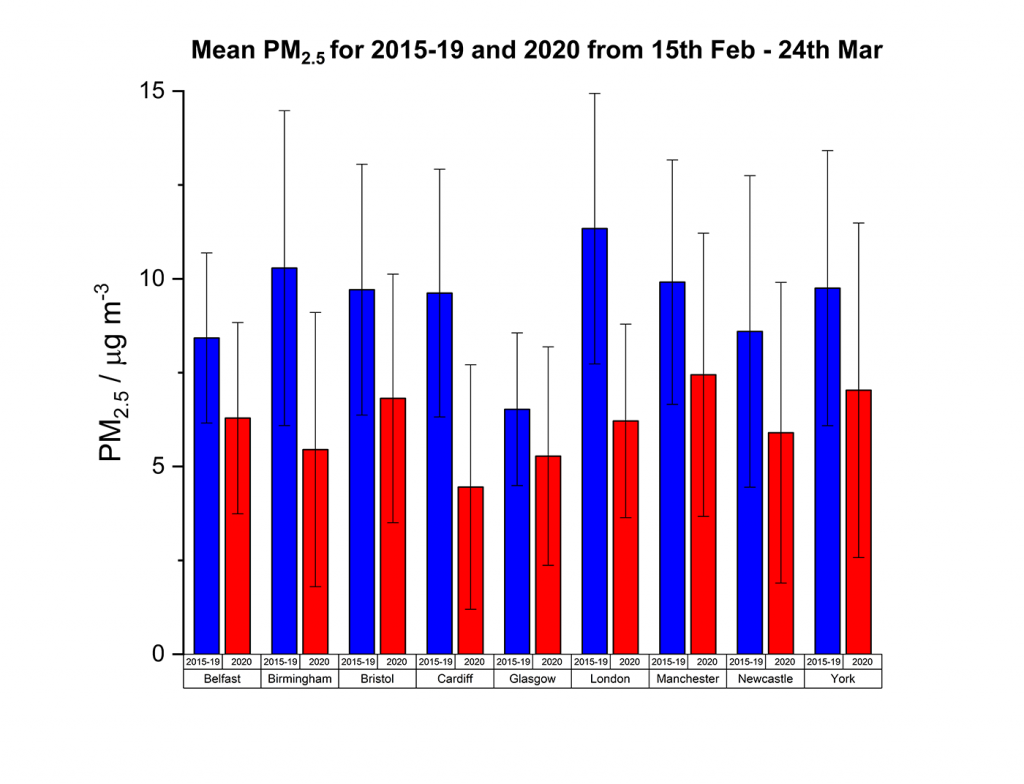
The average level of particulate matter is lower in each city this year.
Professor Ally Lewis, Director of Science at the National Centre for Atmospheric Science added:
“In the midst of a respiratory health crisis such as this, better air quality can only have a small effect, but it will undoubtedly be positive, relative to business as usual levels of pollution.
It is further motivation, as if it were needed, to stay inside and not travel unless necessary, since the emissions and pollution avoided makes a helpful difference.”
Scientists have been able to detect broad patterns in the pollution levels, but it will take further analysis before the exact causes can be identified. This is because pollution levels are always changing – it’s not only human activity that affects pollution levels. Stormy weather can help dilute pollution levels by mixing up air in the atmosphere, while heavy rain can also wash out pollution.
One response to “Air pollution falling across UK cities, latest data shows”